Global map reveals mining’s uneven toll on forests and biodiversity
A new study led by Japanese researchers from Tohoku University and the National Institute for Environmental Studies (NIES) reveals that some of the minerals most essential for green technologies may have ...
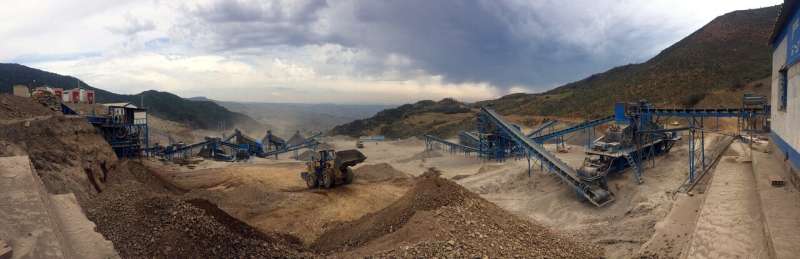
A new study led by Japanese researchers from Tohoku University and the National Institute for Environmental Studies (NIES) reveals that some of the minerals most essential for green technologies may have a significant negative impact on biodiversity. Using remote sensing and machine learning, the scientists produced an unprecedented global map of mined commodities.
Combining this map with public datasets on forest loss and species extinction risk, they then quantified how the extraction of these commodities is reshaping forests and biodiversity worldwide.
Details of the results were published in the journal Nature Communications.
Analyzing approximately 70,000 mining sites across 20 commodities, the study found that mining activities caused the loss of 16,268 km² (6,300 square miles) of forest between 2001 and 2022, an area roughly comparable to the size of Beijing. Most of that loss occurred in rainforests in the Amazon, Southeast Asia and the Congo Basin.
"Advances in remote sensing and machine learning offer new opportunities for automated analysis of mining at a global scale. The transition to green technologies is driving demand for a different set of minerals, but there is insufficient data to fully understand the environmental implications," explained Keiichiro Kanemoto, an associate professor at Tohoku University and author of the study.

Biodiversity risks diverge from forest loss
While the study shows that commodities such as gold and coal remain the largest drivers of deforestation, it reveals a different pattern when biodiversity is considered. Green energy minerals such as lithium show some of the highest biodiversity risks despite being associated with lower levels of forest loss.
This contrast highlights a critical shift: while traditional mining has been defined by large-scale deforestation, the extraction of minerals central to the energy transition may exert subtle—but equally serious—pressures on ecologically sensitive habitats. For example, lithium extraction in salt flat and wetland environments can disrupt fragile ecosystems and endanger species despite minimal visible deforestation.
Balancing mineral demand and habitat protection
Minerals such as lithium, cobalt and nickel are indispensable for technologies like electric vehicle batteries and renewable energy storage, yet their extraction can impose substantial environmental costs. The findings highlight the need to balance decarbonization goals with biodiversity protection, particularly as demand for these materials is expected to rise in the coming decades.

The resulting dataset offers valuable insights for policymakers and industry leaders. Governments can use the data to design targeted, commodity-specific environmental regulations, while companies can better anticipate policy shifts and assess risks within their supply chains. By identifying which commodities and regions carry the greatest environmental costs, the research supports more informed decision-making toward sustainable resource use.
Kanemoto said, "This study represents a major step forward in understanding the true global footprint of mining and demonstrates that the path to a greener future must also account for the hidden environmental costs of the materials that make it possible."
Publication details
Yu-Tong Cheng et al, Mapping global resource driven nature loss in the mining sector from 2001 to 2022, Nature Communications (2026). DOI: 10.1038/s41467-026-73792-9
Who's behind this story?

BSc Life Sciences & Ecology. Microbiology lab background with pharmaceutical news experience in oil, gas, and renewable industries. Full profile →

Bachelor's in mathematical biology, Master's in creative writing. Well-traveled with unique perspectives on science and language. Full profile →
Citation: Global map reveals mining's uneven toll on forests and biodiversity (2026, July 23) retrieved 24 July 2026 from https://phys.org/news/2026-07-global-reveals-uneven-toll-forests.html
This document is subject to copyright. Apart from any fair dealing for the purpose of private study or research, no part may be reproduced without the written permission. The content is provided for information purposes only.